Peer Reviewed Publications
- *Heflin, S., M. Hughe, S. Biswas, A. Morales, R. Cifelli, J. Sedlar, D. Feldman, V. Chandrasekar, and P. Kennedy, 2024: X-band radar and surface-based observations of cold season precipitation in Western Colorado's complex terrain. J. Hydromet. In review.
- *Rudisill, W. J., A. N. Flores, H. P. Marshall, E. Siirila-Woodburn, D. R. Feldman, A. M. Rhoades, Z. Xu, and A. Morales, 2023: Cold-season precipitation sensitivity to microphysical parameterizations: Hydrologic evaluations leveraging snow lidar datasets. J. Hydromet., 25(1), 143-160, https://doi.org/10.1175/JHM-D-22-0217.1.
- *Villalobos, E., A. Morales, D. Martinez-Castro, J. Valdivia, R. Cardenas-Vigo, W. Lavado, and A. Santiago, 2023: Dynamic atmospheric mechanisms associated with the diurnal cycle of hydrometeors and precipitation in the Andes-Amazon transition zone of Center Peru during summer season. Journal of Earth System Science. Accepted.
- de Boer, G., and Coauthors including A. Morales, 2023: Supporting advancement in weather and water prediction in the Upper Colorado River Basin: The SPLASH Campaign. Bull. Amer. Met. Soc., 104(10), E1853-E1874, https://doi.org/10.1175/BAMS-D-22-0147.1.
- Morales, A., M.J. Molina, J.E. Trujillo-Falcón, K. M. Nuñez Ocasio, A. L. Lang, E. Murillo, C. Bieri, B. S. Barrett, L. B. Avilés, and S. J. Camargo, 2023: Commitment to Active Allyship is Required to Address the Lack of Hispanic and Latinx Representation in the Earth and Atmospheric Sciences. Bull. Amer. Met. Soc., 104, E1290-E1313, https://doi.org/10.1175/BAMS-D-22-0075.1.
- *Villalobos, E., J. Flores, M. Castro, A. Morales, K. Mosquera, W. Lavado, and F. Silva, 2022: Summertime precipitation extremes and the influence of atmospheric flows on the western slopes of the southern Andes of Peru. International Journal of Climatology, 42(6), 9909-9930. https://doi.org/10.1002/joc.7871
- Morales, A., L. Medina Luna, D. Zietlow, J. LeBeau, and M. Molina, 2022: Testing the Impact of Culturally-Relevant Communication Style on Engagement with Hispanic and Latinx Adults. Journal of Geoscience Education, DOI: 10.1080/10899995.2022.2120701
- Morales, A., D. J. Posselt, H. Morrison, 2021: Which combinations of environmental conditions and microphysical parameter values produce a similar orographic precipitation distribution? J. Atmos. Sci., 78, 619-638, https://doi.org/10.1175/JAS-D-20-0142.1
- Morales, A., D. J. Posselt, H. Morrison, and F. He, 2019: Assessing the Influence of Microphysical and Environmental Parameter Perturbations on Orographic Precipitation. J. Atmos. Sci., 76, 1373-1395, https://doi.org/10.1175/JAS-D-18-0301.1
- Morales, A., H. Morrison, and D. J. Posselt, 2018 : Orographic precipitation response to perturbations in microphysical parameters for idealized moist nearly neutral flow. J. Atmos. Sci., 75, 1933-1953, https://doi.org/10.1175/JAS-D-17-0389.1
- Morales, A., R.S. Schumacher, and S.M. Kreidenweis, 2015: Mesoscale vortex development during extreme precipitation: Colorado, September 2013. Mon. Wea. Rev., 143, 4943-4962, https://doi.org/10.1175/MWR-D-15-0086.1
- Morrison, H., A. Morales, and C. Villanueva-Birriel, 2015: Concurrent sensitivities of an idealized deep convective storm to parameterization of microphysics, horizontal grid resolution, and environmental static stability. Mon. Wea. Rev., 143, 2082-2104, https://doi.org/10.1175/MWR-D-14-00271.1
Non-Peer Reviewed, Opinion Pieces
- Morales, A., C.L. Walker, D. L. Carroll-Smith, and M.A. Burt, 2021: Code-switching and assimilation in STEM culture. Eos, 102, Published on 28 July 2021. https://doi.org/10.1029/2021EO161232.
- Morales, A., 2015: Cyclonic circulation development during extreme precipitation. Down to Earth, Physics today. Published on 21 April 2015. https://physicstoday.scitation.org/do/10.1063/PT.5.4012/full/
Research ideas looking for collaborators/funding/time
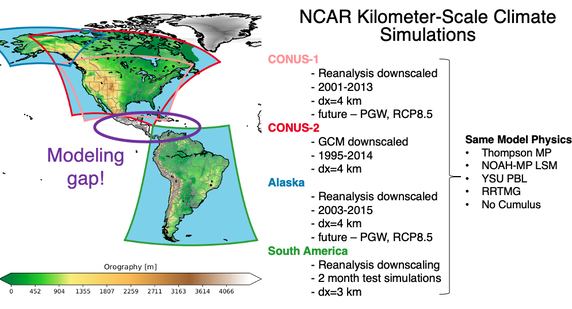
Courtesy: Andreas Prein (NCAR)
|
Idea: Kilometer-scale climate simulations for Mexico/Central America/Caribbean High-resolution, long-term simulations exist for different domains including the Contiguous US (CONUS) and South America, yet a modeling gap exists over a smaller and meteorologically active domain - Mexico, Central America, and the Caribbean! Kilometer-scale models can provide novel insights in mesoscale processes particularly in poorly observed regions.
I propose to create a "Mesoamerica" 40-year retrospective simulation (1980-2020) at 4-km horizontal grid spacing. Numerous researchers could benefit from this simulation to:
If you're interested, let's talk! |
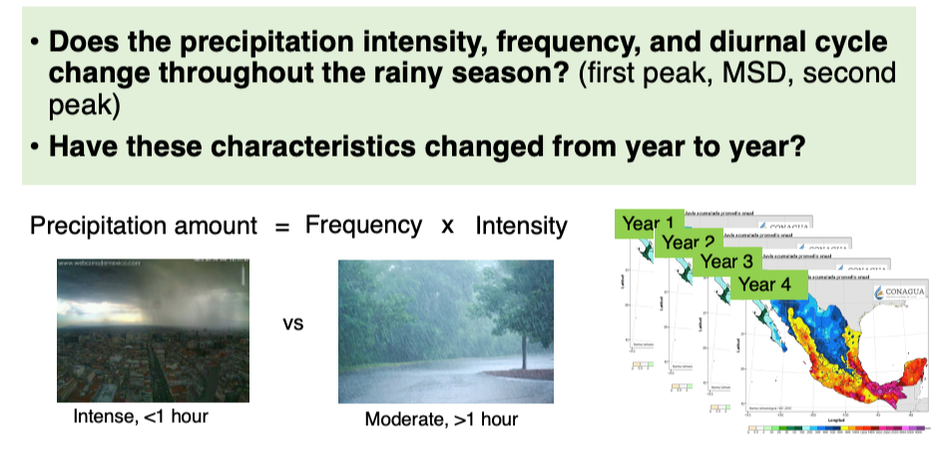
Idea: Precipitation variability and intermittency of Southwestern MexicoPrecipitation over Mexico varies depending on the region of interest, but overall climatology shows the highest precipitation amounts over southern and central Mexico. This high precipitation generally occurs from May-October, but within this rainy season central and southern Mexico (in addition to central America and the Caribbean) experience a bimodal precipitation distribution. The precipitation minimum is called the Midsummer Drought (MSD) or La canícula or Veranillo, which can result in up to a 40% decrease in precipitation.
The variability in precipitation is critical because farmers rely on rain to water their crops and need to know precipitation onset and amount to determine when and how deep to till the soil. I would aim to answer the questions:
|
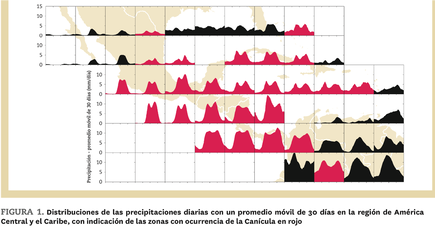
Red represents the regions with a bimodal precipitation distribution, known as the midsummer drought or la canícula (UNESCO 2018)
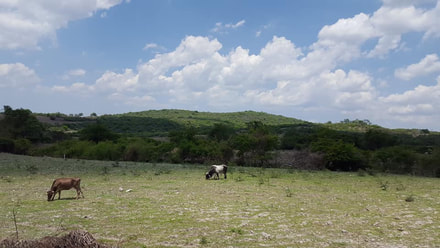
Ceja Blanca, Guerrero, Mexico
|
Previous Research Studies
|
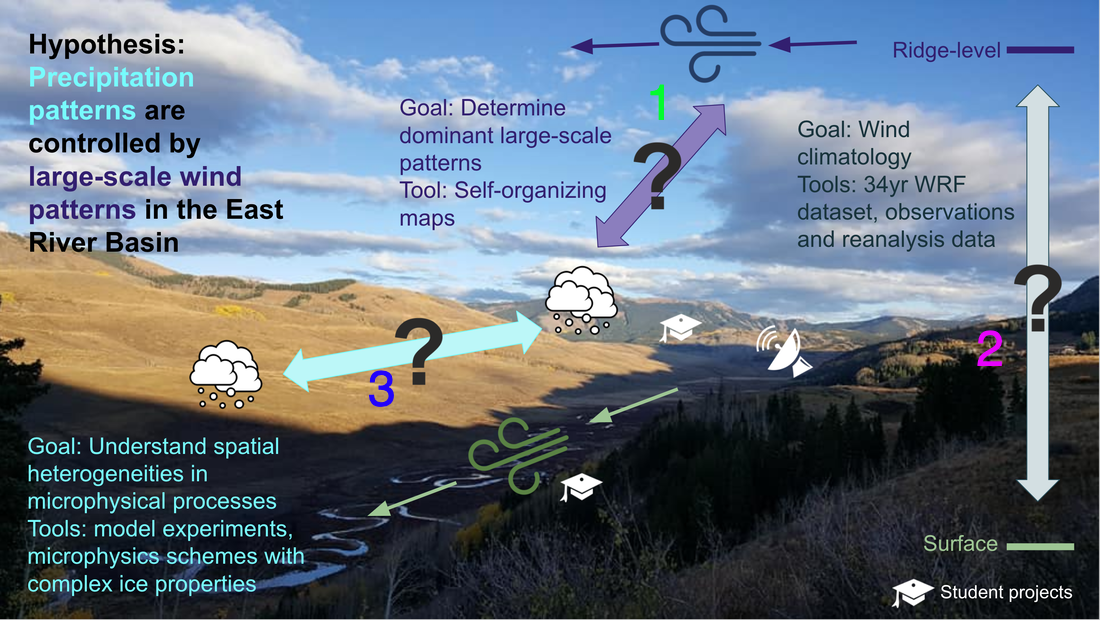
Annareli's current research examines 1) the large-scale weather patterns impacting the East River basin in Crested Butte, CO, 2) the relationship between the dominant wind regimes and precipitation distribution in this inter-mountain valley, and 3) applies observations from the SPLASH field campaign to understand local wind patterns, precipitation, and cloud microphysics characteristics.
|
Looking south along the East River near Gothic, CO. October 2021.
|
YouTube links to the science videos:
|
Testing the Impact of Culturally-Relevant Communication Style on Engagement with Hispanic and Latinx Adults
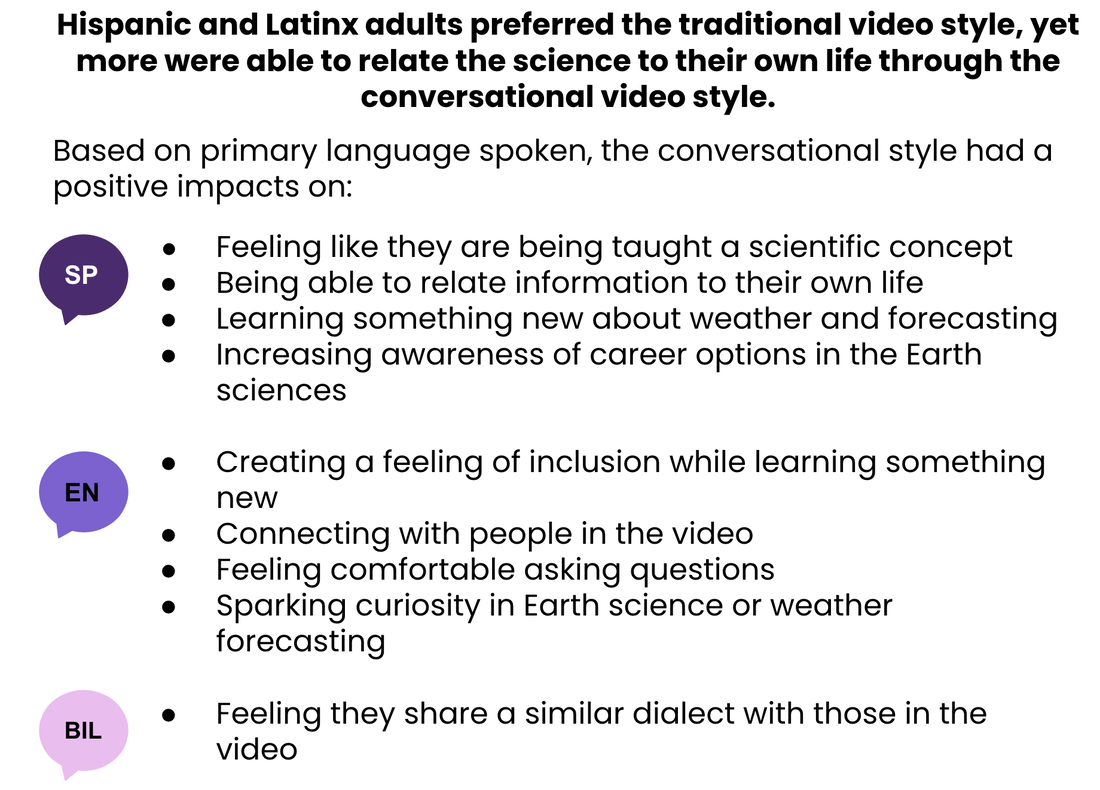
This study tested the impact that communication style has on feelings of inclusion, learning, and engagement in the Earth sciences for Hispanic and Latinx adults. An online survey with open and closed questions was used to evaluate two science videos (in both Spanish and English) with different communication styles: 1) a traditional, interview-based style, where experts present a science concept, and 2) an informal conversational style, where a scientific message is shared through a casual conversation. Hispanic and Latinx adults preferred the traditional video, but the conversational video ranked higher in other aspects, which varied based on participants’ primary spoken language at home.
Morales, A., L. Medina Luna, D. Zietlow, J. LeBeau, and M. Molina, 2022: Testing the Impact of Culturally-Relevant Communication Style on Engagement with Hispanic and Latinx Adults. Journal of Geoscience Education. https://doi.org/10.1080/10899995.2022.2120701 |
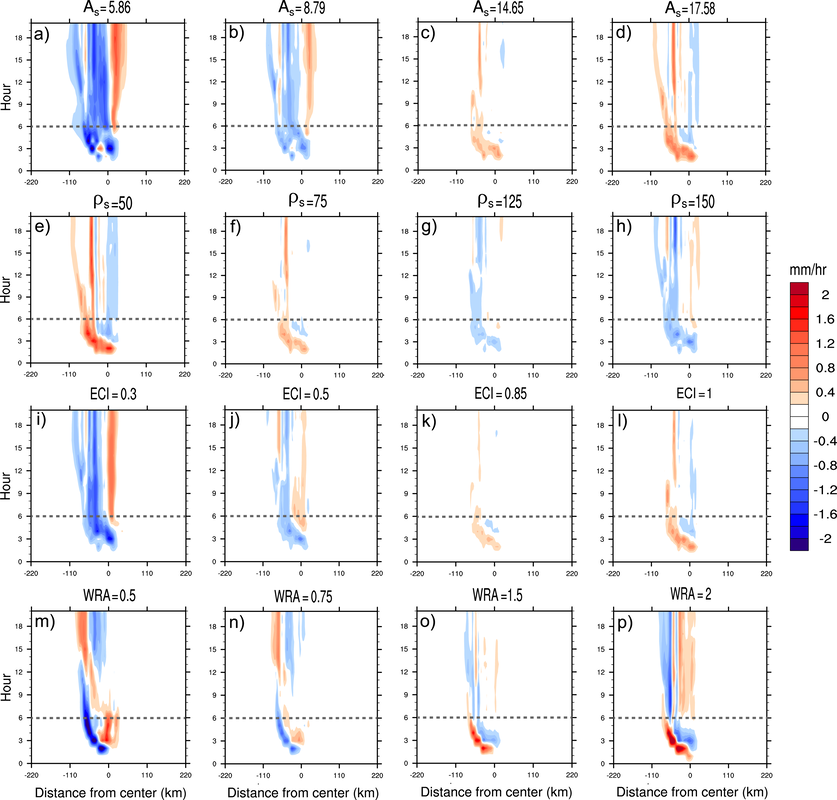
Hövmöller diagrams of precipitation rate difference (mm/hr) between microphysics parameter perturbation experiments and the control. Panels show perturbations for different values of (a)–(d) As [control = 11.72 m(1−b) s−1], (e)–(h) ρs (control = 100 kg m−3), (i)–(l) ECI (control = 0.7), and (m)–(p) WRA (control = 1). Blue colors represent larger precipitation rates for the control, red colors represent larger precipitation rates for the parameter perturbation experiment. Horizontal dashed lines show hour 6, where temporal averaging begins. More details in Morales et al. (2018).
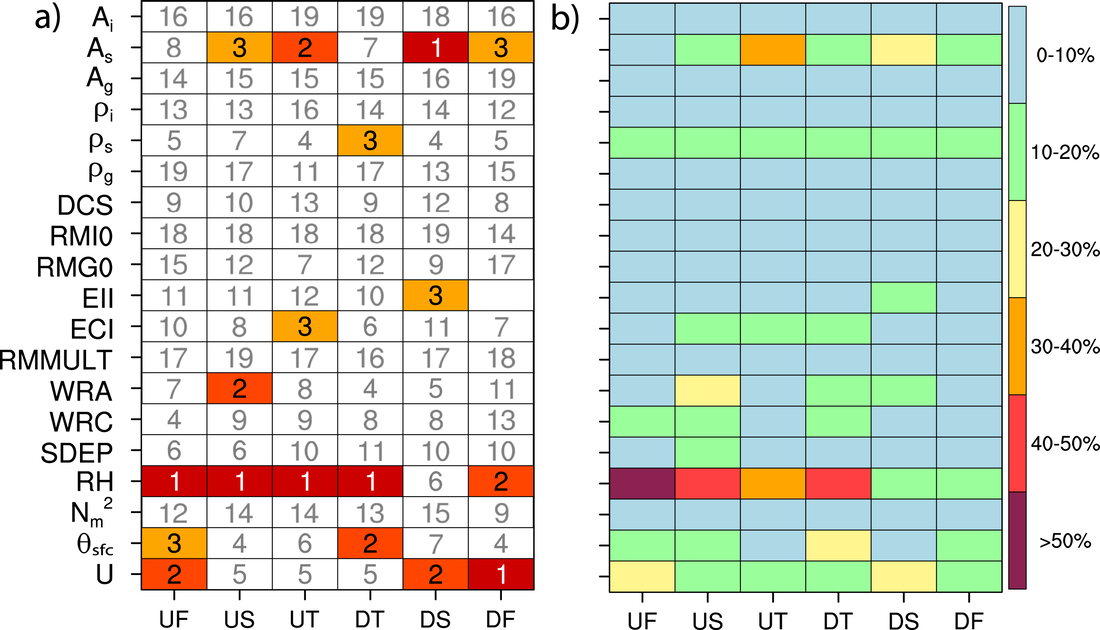
(a) Ranking of precipitation rate (mm/hr) sensitivity to multi-parameter perturbations. Rank 1 represents the largest change to precipitation rate, while rank 19 represents the smallest change for the simulations. (b) Fractional sensitivity (%) of precipitation rate (mm/hr) to multi-parameter perturbations. Rows are input parameters and columns show each region over the mountain. See Morales et al. (2019) for details.
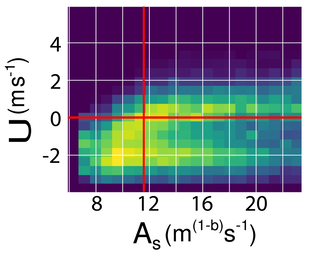
2D histogram (brighter colors represent higher probability that parameter value combination produced the precipitation distribution of interest) showing a generally positive relationship between snow fallspeed (As) and horizontal wind speed (U is an additive factor where 4 m/s represents an increase to the entire wind speed profile by 4 m/s). The red lines represent the control values that were used to produce the precipitation distribution from the CM1 model.
|
Exploring the Microphysical and Environmental Controls on Orographic Precipitation from Atmospheric RiversMy PhD dissertation involves understanding which environmental and microphysical parameters control where and how much precipitation falls when an atmospheric river interacts with terrain. An atmospheric river (AR) is a long filament of very moist air extending from the tropics to the extra-tropics. When ARs interact with the West Coast mountains of the US, heavy precipitation occurs on the windward side of the mountain. This results in flash flooding and up to 50% of the fresh water resources, mostly through snowfall. To understand how our forecasts of these AR events are affected by parameter uncertainty in our numerical models, I perform idealized simulations of 2D moist, nearly neutral flow over a bell-shaped mountain and perturb multiple microphysical parameters. In addition, I test the affect of environmental parameter uncertainty over a typical range of observational uncertainty. I have applied a statistical technique called the Morris Screening Method, which performs multi-parameter perturbations to determine the most influential parameters to precipitation, while being computationally affordable. This method also accounts for possible non-linear parameter perturbations and provides a subset of the most influential parameters to precipitation to be further analyzed using more complex Bayesian methods. The results from my dissertation have a broader impact on hazard prediction, water management, and ensemble forecasting. Please see the publications associated with my PhD for further details:
Morales, A., H. Morrison, and D. J. Posselt, 2018 : Orographic precipitation response to perturbations in microphysical parameters for idealized moist nearly neutral flow. J. Atmos. Sci., 75, 1933-1953. doi:10.1175/JAS-D-17-0389.1 Morales, A., D. J. Posselt, H. Morrison, and F. He, 2019: Assessing the Influence of Microphysical and Environmental Parameter Perturbations on Orographic Precipitation. J. Atmos. Sci., 76(5), 1373-1395. doi:10.1175/JAS-D-18-0301.1 Morales, A., D. J. Posselt, H. Morrison, 2021: Which combinations of environmental conditions and microphysical parameter values produce a given orographic precipitation distribution? J. Atmos. Sci., 78, 619-638, https://doi.org/10.1175/JAS-D-20-0142.1 |
Effect of Latent Heating on Mesoscale Vortex Development during Extreme Precipitation: Colorado, September 2013I investigated a mesoscale vortex (mesovortex) that was observed during the heavy precipitation event of September 2013 in Colorado. This mesovortex was observed at the same time as the city of Boulder experienced its heaviest rainfall rates, which resulted in flash flooding. One of the goals of the study was to understand the relationship between the physical processes occurring in the storm, the development of the circulation, and the circulation's effects on the environment. To explore these relationships, the WRF model to simulate the mesovortex and test the effects of latent heating on its development. Results suggested that the latent heat released from the storm system led to the development of the mesovortex near the surface. Furthermore, the mesovortex had an influence on the environmental flow, enhancing convection and precipitation. These findings are important because if we want to properly forecast extreme precipitation and the potential for flash flooding, our numerical weather prediction models need to be capable of representing the physical processes within the storm and their impact on the development of such mesovortices, which both result from, and help enhance heavy rain.
Morales, A., R.S. Schumacher, and S.M. Kreidenweis, 2015: Mesoscale vortex development during extreme precipitation: Colorado, September 2013. Mon. Wea. Rev., 143, 4943-4962. doi:10.1175/MWR-D-15-0086.1 |
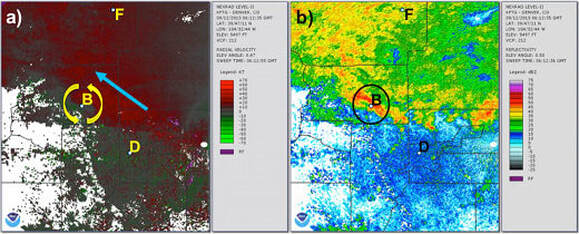
Radar observations from the Denver (KFTG) radar at 0612 UTC 12 September 213 showing the mesoscale vortex over Boulder. (a) Radial velocity showing a couplet of winds toward the radar (green) and away from the radar (red) in close proximity. The couplet is associated with rotation. The blue arrow represents the direction of upslope flow. (b) Radar reflectivity showing an enhanced convective band over Boulder. The cities of Fort Collins (F), Boulder (B), and Denver (D) are provided as reference.
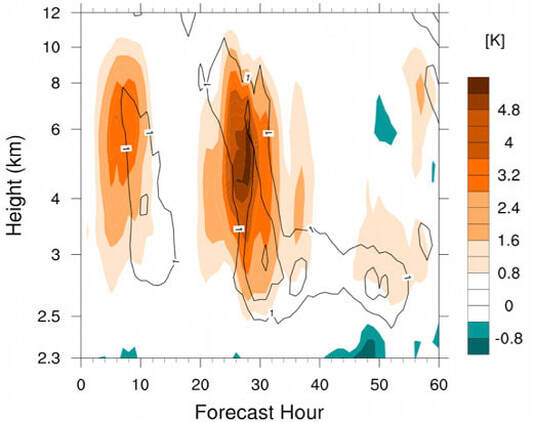
Time–height plot of accumulated latent heating (color filled; kelvin) and potential vorticity (black contours starting at 1 PVU at 0.5 PVU intervals) for each hour in the control simulation. Note, the vertical axis is geopotential heights in km mean sea level and is stretched to emphasize the midlevels of the troposphere. 12 September encompasses forecast hours 24–47.
|
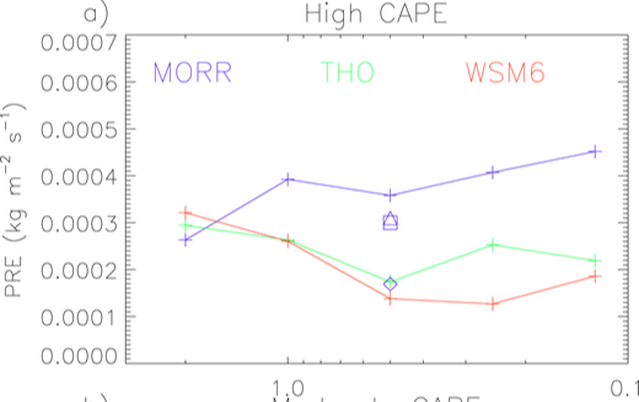
Horizontally and temporally averaged (from 60 to 120 min) surface precipitation rate (PRE) as a function of Δx for the high CAPE sounding. Results for each microphysics scheme are indicated by the colored symbols and lines. Results are also shown for the sensitivity tests using MORR microphysics and Δx = 500 m but with no cold pool (blue triangles), graupel instead of hail for the rimed ice species (blue diamonds), and N0 specified as a constant 8 × 10^6 m^−4 (blue squares).
|
Concurrent Sensitivities of an Idealized Deep Convective Storm to Parameterization of Microphysics, Horizontal Grid Resolution, and Environmental Static StabilityThe WRF model was used to simulate an idealized, isolated, single-cell deep convective storm. The sensitivity of the storm development, intensity, structure, and precipitation efficiency to different microphysical parameterizations at various horizontal grid spacings and for different CAPE soundings were analyzed.
Morrison, H., A. Morales, and C. Villanueva-Birriel, 2015: Concurrent sensitivites of an idealized deep convective storm to parameterization of microphysics, horizontal grid resolution, and environmental static stability. Mon. Wea. Rev., 143, 2082-2104. doi:10.1175/MWR-D-14-00271.1 |
I have a very strong feeling that science exists to serve human betterment and improve human welfare. |
